Who would survive the Titanic?

There’s a practice exercise on Kaggle that gives Titanic passenger data and asks us to find the best predictor of survival. The exercise seems exciting, so, in this post, I will dive into Titanic data.
I will first present relationships between passengers’ attributes and their survival rate. Then, I’ll attempt to create a model for predicting survival. We’ll see what information matters and what doesn’t.
Data available
Kaggle gives data on a random sample of 2344 passengers: their class, age, family relationships, lodging, and general trip information.
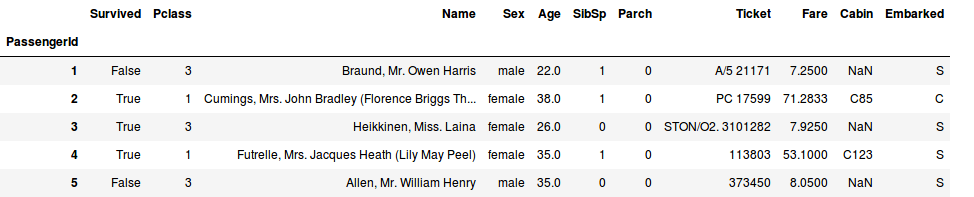 Input data
The general survival rate – the most important metric – rate was 38.4%.
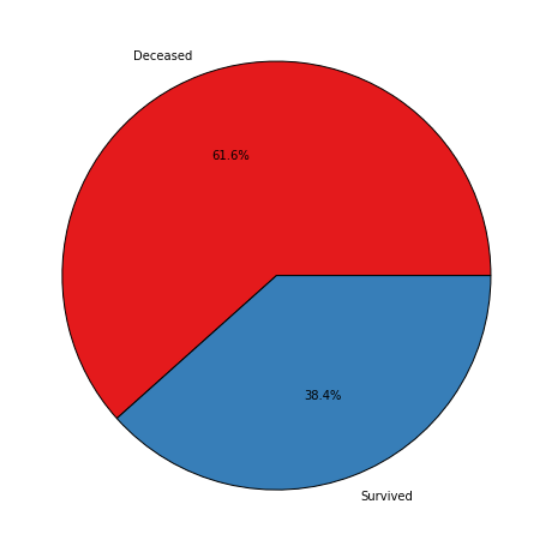 Survival and death rates
Age, Gender, Wealth – basic correlations
Let’s see how important each attribute is on its own.
Age
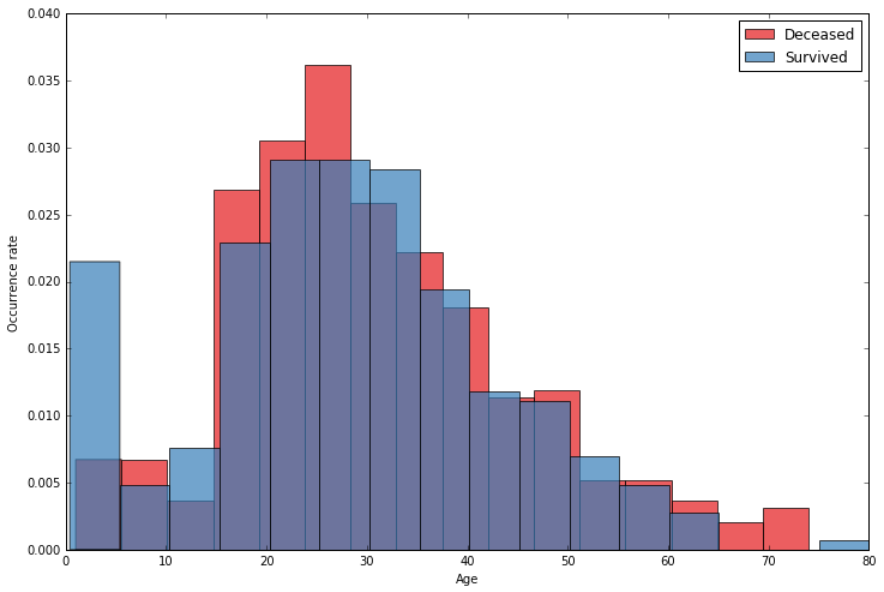 Distribution of ages among survivors and victims
Note that around 20% of entries did not have the age attribute.
Gender
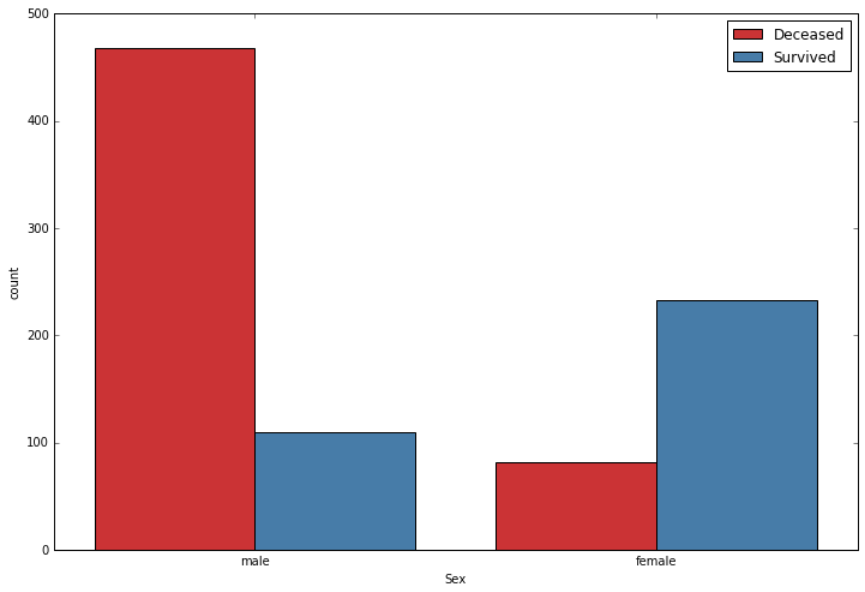 Survival rate with respect to gender
Wealth
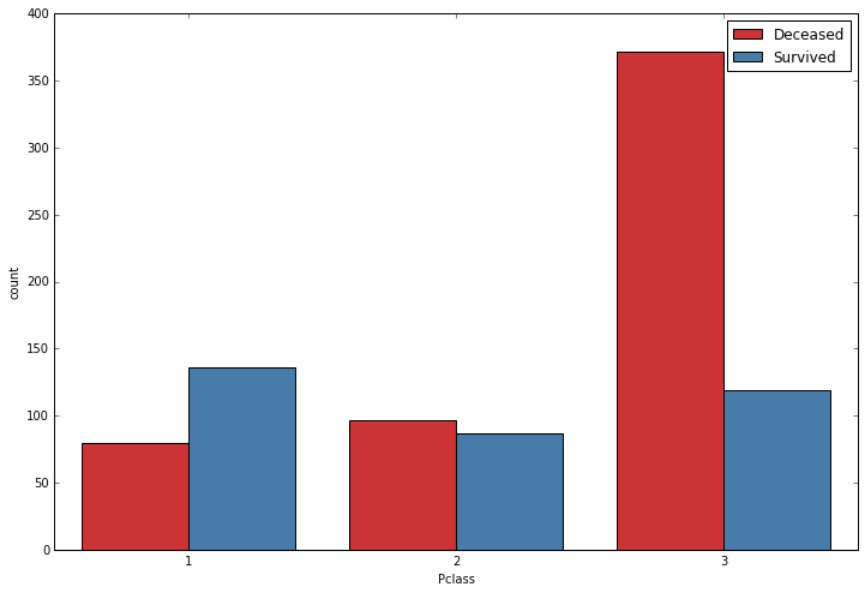 Survival rate with respect to class
Lodging
There were 8 main decks on Titanic: from A to G, and auxiliary decks like Tank deck.
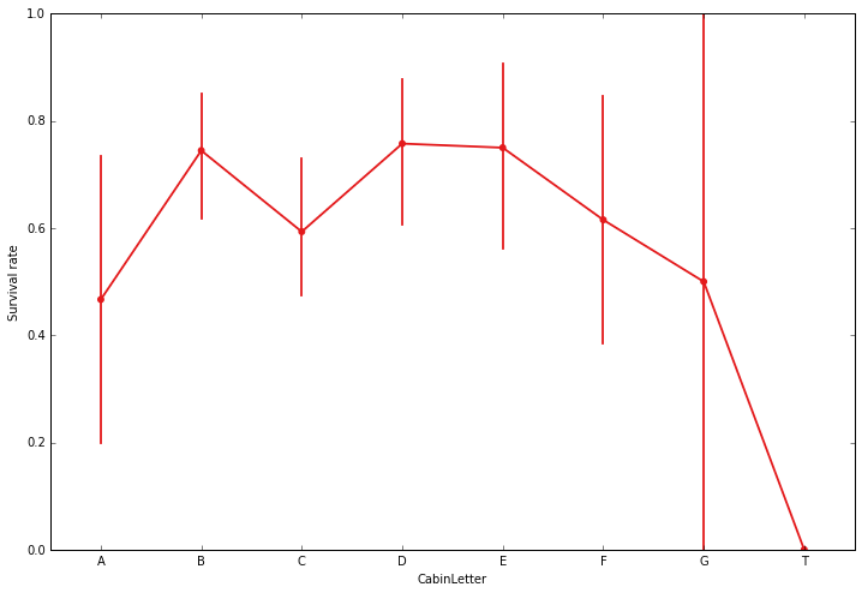 Survival rate with respect to the cabin’s deck
Only 22.9% of passengers have cabin data in the sample, which explains why this attribute is highly biased.
Feature importance
There are other meaningful features, but we covered the most interesting ones. Here’s a comparison of relative feature importances as measured using relative Gini importance.
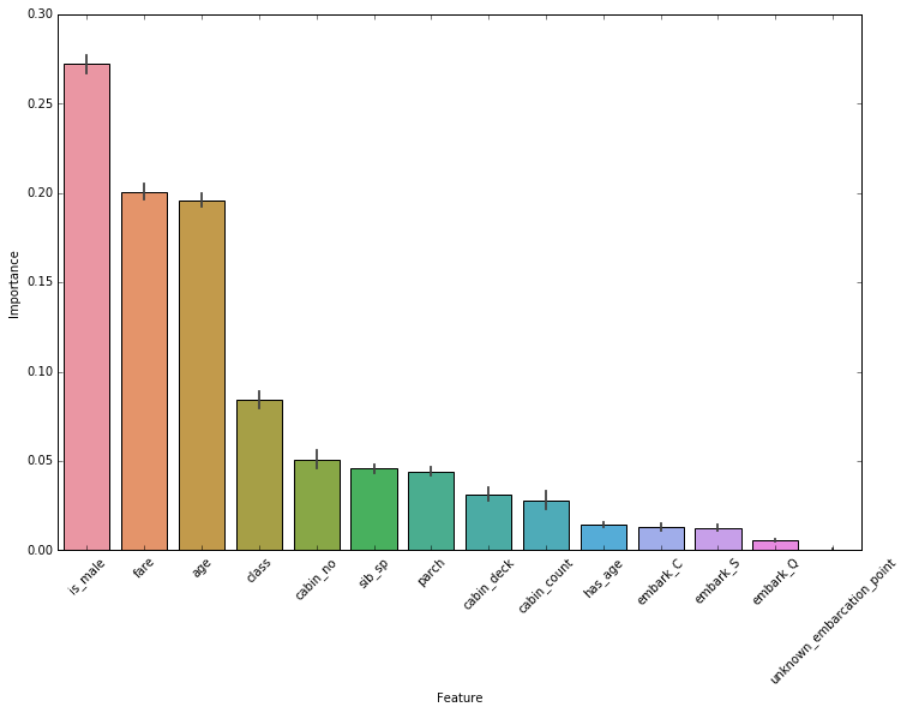 Feature importance
Classification
I’ve tried using decision tree-based models as predictors. Note, that the base survival rate was 38%; even a classifier that always gives “Death” verdict would have 62% accuracy.
From the initial survey, it looks the gender is the best indicator of survival, and, indeed, a tree that just splits based on gender has 79% of estimated accuracy.
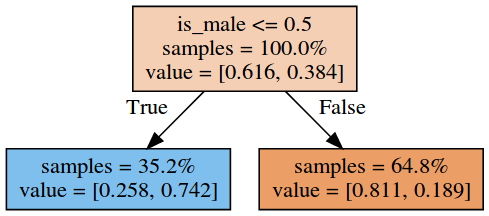 A decision tree based on gender
Putting all data that is available in the input set doesn’t increase the estimate by much: only up to 82%. Here’s one of the best decision trees that I have trained:
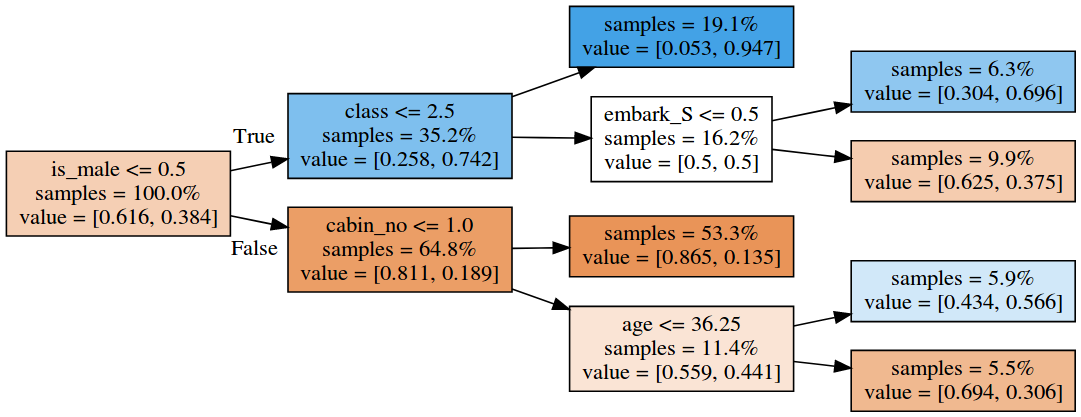 One of the best decision trees.
The tree would predict that men with a cabin number and that are less than 36 years old would survive. According to the model, Women in the third class who embarked from Southampton would die.
I’ve also tried using more complicated models. A gradient boosted decision tree would get even 85% accuracy when measured using cross-validation.
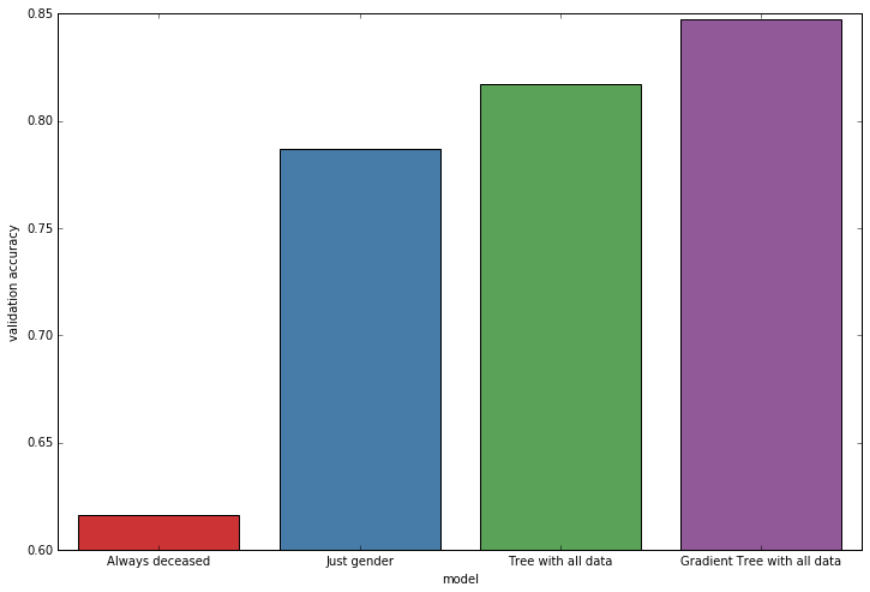 Comparison of CV accuracy of all models
Verification with test data
I submitted results from all four models, and a surprising thing happened. The gradient boosted model performed worse than the gender-based tree. The likely explanation here is that I’ve been creating overfitted models.
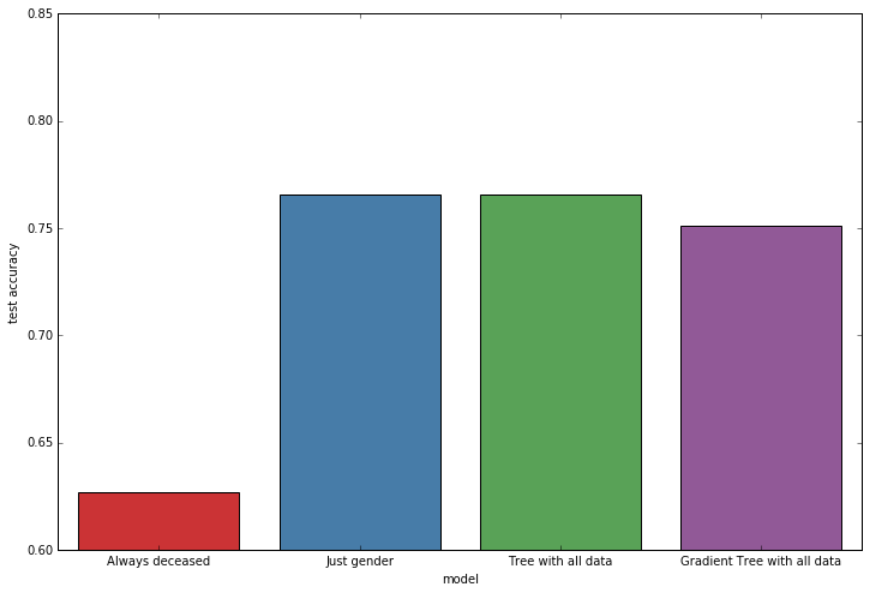 Comparison of test accuracy of all models
Source
The Jupyter notebook I used for this analysis is available on Kaggle.